Dr. Paul Treacy teaches Social Policy Analysis course (SOPA 400). He wants to have training for his students on visualizing data using Tableau. His students don’t have a lot of experience in data visualization. Using National Longitudinal Surveys of Youth Data (NSLY) data in Fall 2019 and Medical Expenditure Panel Study (MEPS) data in Fall 2020, Jane covered the basic workflow of using Tableau Public. Jane used hands-on activities to show students how to connect to data sources, how to create a line chart, a bar chart, a text table, and a map, how to create a dashboard, how to create a story, and how to save and share the created work.
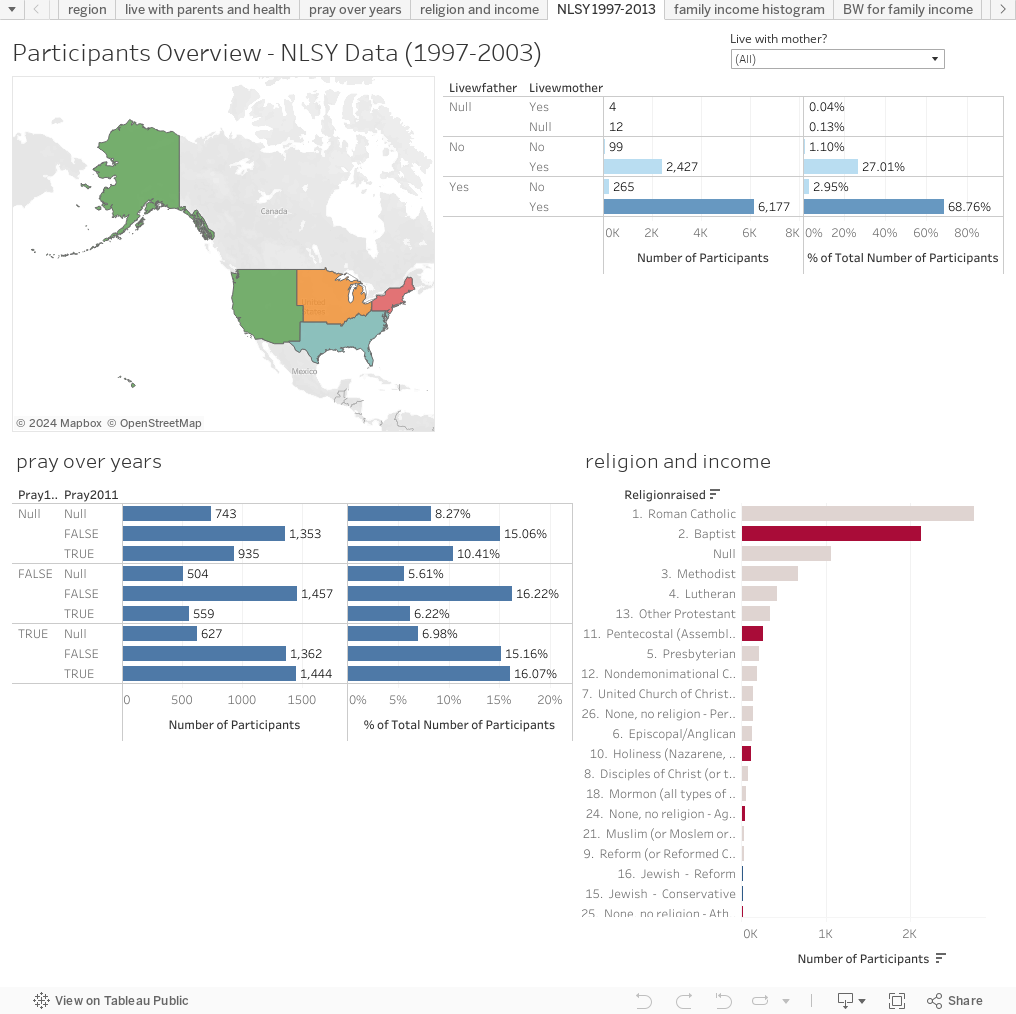
Viz of National Longitudinal Surveys of Youth Data (NSLY) data
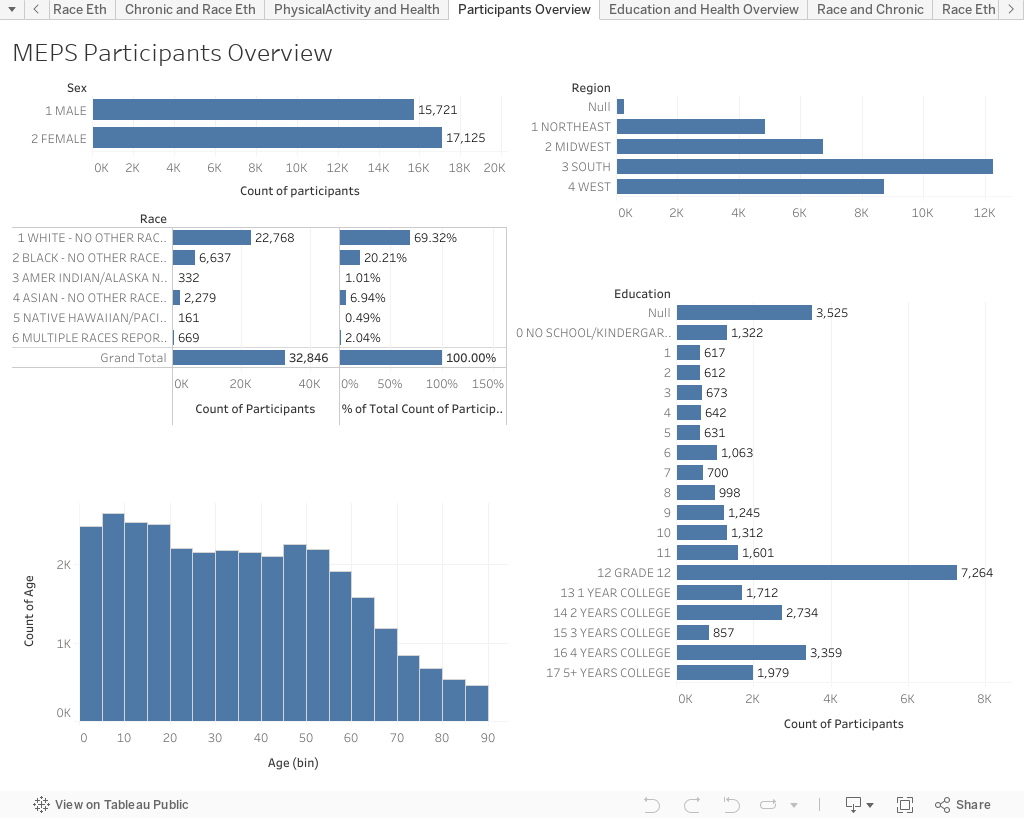
Viz of Medical Expenditure Panel Study(MEPS) data