The data ranges from 2013 through October 2019 that covers all the DMC in-class workshops and general public workshops.
The data ranges from 2013 through October 2019 that covers all the DMC in-class workshops and general public workshops.
If the embedded Viz doesn’t work well, click on the following link to view it.
DMC started to offer Introduction to Infographics and Data Visualization workshop in Fall 2015. Jane used Google Chart to create this interactive chart based on the monthly equipment charges over years. You could see the equipment checkout trend and patterns.
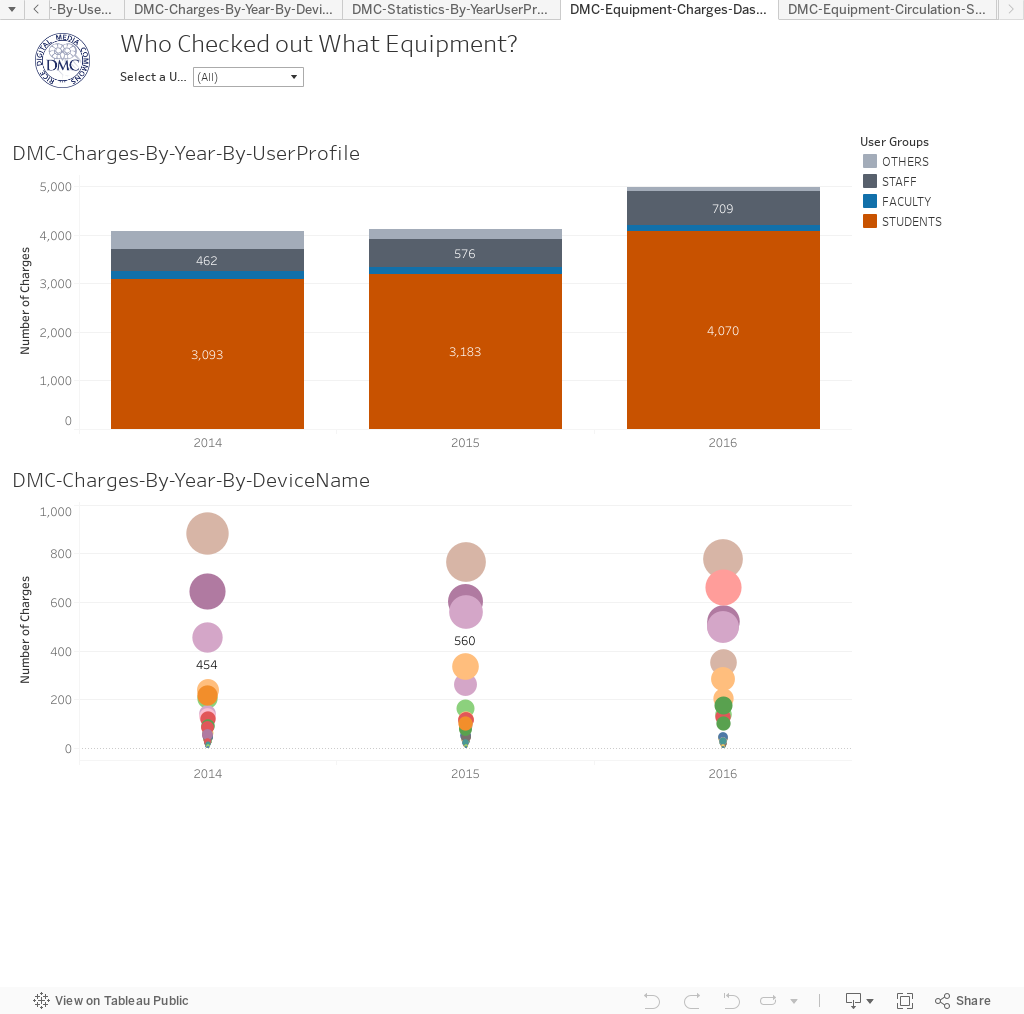
Thanks to the great help of Mang Sun, system librarian, DMC is able to offer its first workshop on Tableau Public in Spring 2017. The Introduction to Tableau Public workshop uses the DMC equipment circulation data as a sample data set to explore basic features and functions of Tableau Public. You could tell the equipment checkout trend, patterns, and interesting findings based on the data of 2014, 2015, and 2016.
Here is the link to the published Viz.
Below is the embedded published Viz. Scroll down to the bottom of the Viz, click on the full screen icon ![]() at the lower right corner to see the beauty of the chart.
at the lower right corner to see the beauty of the chart.